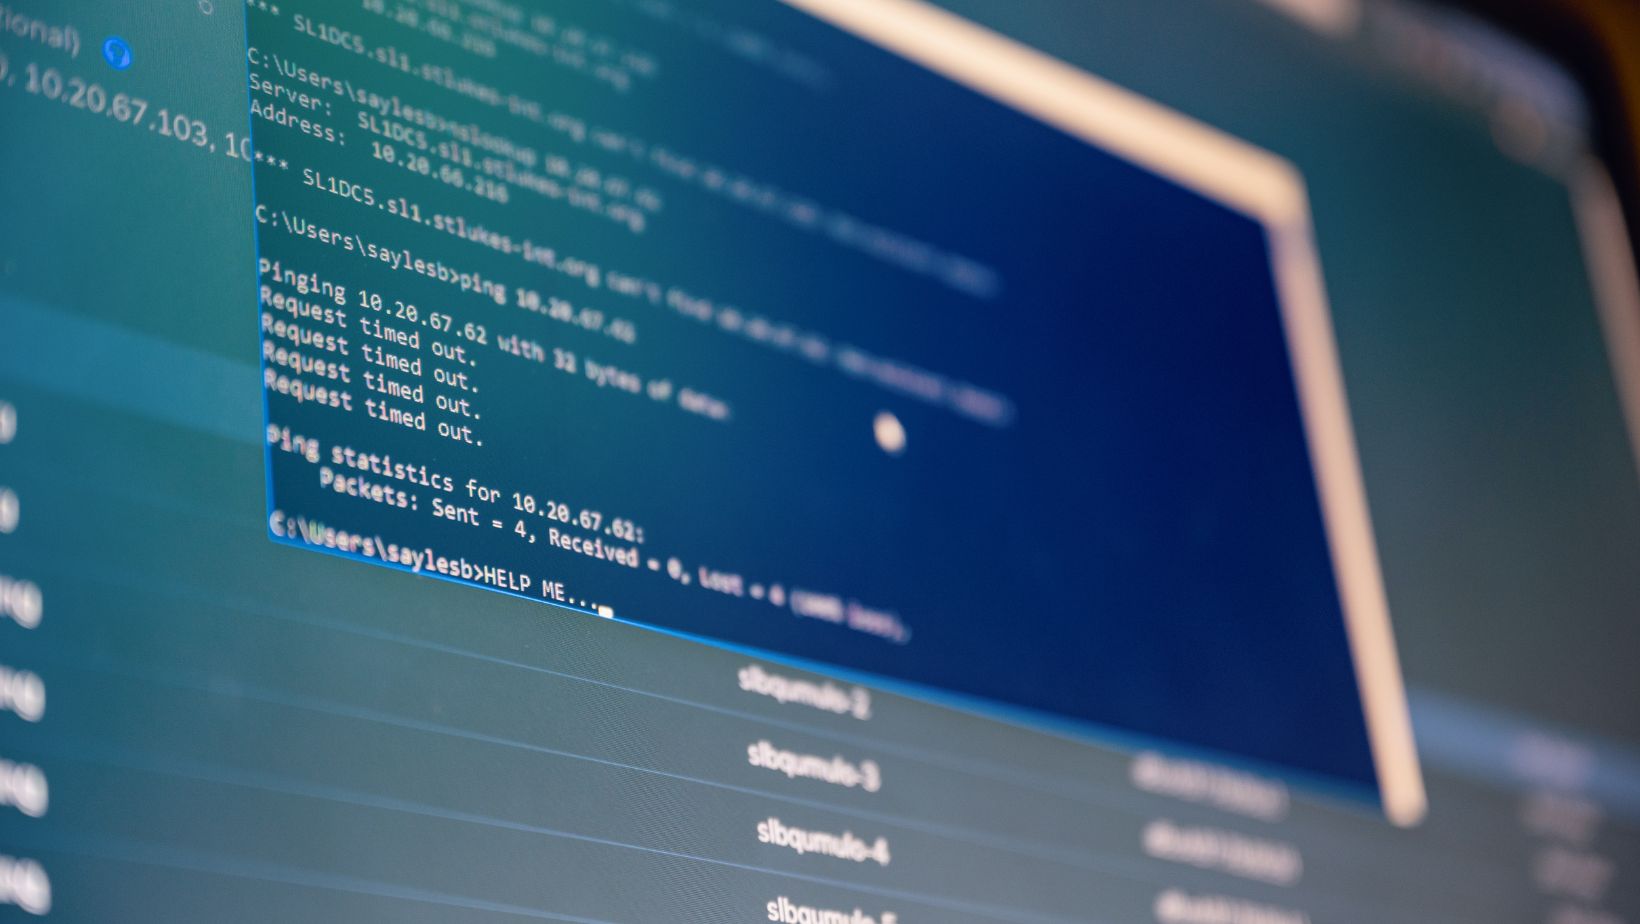
 Few things are more frustrating than a sluggish system, whether it’s a personal workstation grinding to a halt or an enterprise server struggling to handle user requests. System slowdowns can lead to missed deadlines, poor user experience, and even revenue losses for businesses. Fortunately, many of the root causes behind poor system performance can be uncovered through one key resource: your system logs.
Log analysis provides a window into what’s really going on behind the scenes, allowing you to detect performance issues, misconfigurations, and even security threats before they become critical problems.
What Are System Logs?
System logs are files that record events happening within the system, everything from hardware errors to user login attempts. On Linux-based systems, logs are typically stored in the /var/log/ directory and include a variety of log files such as:
- syslog – general system messages
- auth.log – authentication events
- kern.log – kernel activity
- dmesg – boot and hardware detection
 By analyzing these logs, administrators can reconstruct a timeline of events, detect anomalies, and understand what’s affecting system performance.
Identifying the Causes of System Slowdowns Through Logs
Here are some of the most common system performance issues and how logs can help uncover them:
- Excessive CPU or Memory Usage
If your system is slow to respond or frequently freezing, high CPU or memory utilization might be the cause. Logs can show which processes were running at the time of the slowdown, how much memory was being used, and whether certain applications were hogging resources.
- Disk I/O Issues
Disk-related bottlenecks can lead to significant performance degradation. For example, if a drive is close to failing, the system may repeatedly attempt to read or write data, leading to delays. Kernel logs often contain entries about I/O errors, filesystem corruption, or swap usage spikes that can hint at the root problem.
- Network-Related Bottlenecks
Sometimes the system itself is fine, but communication with other servers or services is delayed. Network logs and firewall logs may reveal packet loss, high latency, or misconfigured routing tables. These issues can severely impact application performance, especially for web-based services.
- Misconfigured Services or Crashing Applications
Services that start, fail, and restart in a loop are commonly documented in system or application logs. These repetitive cycles can consume resources and degrade system performance. Logs can help trace back to the configuration files or code changes that triggered the problem.
- Security Events Affecting Performance
Malicious activity such as brute-force attacks or malware infections can quietly slow your system. For instance, a compromised machine might be used as part of a botnet, draining bandwidth and processing power. By reviewing Linux audit logs, administrators can detect unauthorized access, changes to critical files, or escalation of privileges, all of which may impact performance and indicate deeper security concerns.
Tools for Smarter Log Analysis
Going through logs line by line isn’t realistic for most administrators. Thankfully, a variety of tools are available to help manage, parse, and visualize logs more effectively:
- Logwatch: Provides summaries of log files and highlights unusual entries.
- Logrotate: Helps manage large volumes of log files by rotating, compressing, and removing old logs.
- ELK Stack (Elasticsearch, Logstash, Kibana): A powerful open-source suite for collecting, analyzing, and visualizing logs in real-time.
- Graylog: Centralizes log data and offers custom dashboards, alerts, and user-friendly search capabilities.
- Splunk: Enterprise-grade software with machine learning capabilities to detect anomalies and generate actionable insights.
Great Practices for Effective Log Monitoring
To make the most of log analysis, consider these best practices:
- Centralize Logging: Collect logs from all systems into a centralized platform for easier management and cross-system analysis.
- Automate Alerts: Set up notifications for events that typically precede performance degradation, such as repeated service failures or excessive memory use.
- Establish Retention Policies: Retain logs for an appropriate duration to comply with policies and enable long-term trend analysis.
- Regularly Audit Logs: Schedule periodic reviews to ensure you don’t miss emerging issues that could affect performance.
To Sum Up
When your system slows down, your first instinct might be to upgrade hardware or restart services, but the real answers often lie in your logs. By leveraging log analysis, you gain visibility into your system’s behavior, enabling you to diagnose performance issues accurately and act quickly.
From pinpointing memory hogs and uncovering faulty configurations to spotting early signs of cyberattacks, log analysis is one of the most powerful tools at your disposal.


